
Energy prediction is crucial for building decarbonisation. As part of my MSc dissertation at the University of Bath, I built a pipeline that combines diversity-sparse open data with open weather records and novel geospatial embeddings to predict annual residential building energy use intensity.
Problem
Annual energy is crucial for energy optimisation of both residential and commercial assets and the datapoint is often unavailable due to legal and data collection issues. The energy consumption can be predicted from external characteristics such as floor area and type of use, but with a substantial error. Additionally, open-source data are low in feature diversity and are often limited to a few building characteristics and some weather or climate variables.
While short-term prediction methods are well-researched and optimised, they can’t be reliably used for long-term prediction. Yet, even available models often use data obtained from surveys that are impractical in real settings and thus a method that produces precise estimations is essential.
Data
I built a unique data pipeline that combined three different data sources based on geographic identifiers. The main data source was Building Performance Database (BPD), which contains energy-related data on thousands of U.S. commercial and residential buildings across several years.
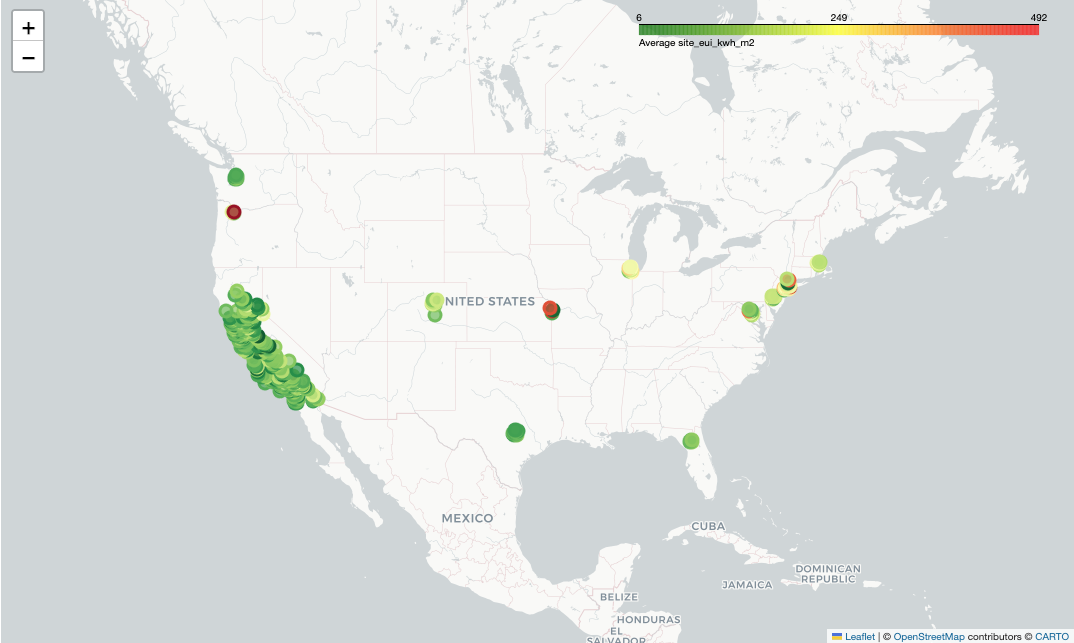
Figure 1: Visualisation of eligible residential buildings from BPD.
The second dataset was National Oceanic and Atmospheric Administration (NOAA). I developed a pipeline for efficient data collection from their API and collected hundreds of weather and climate related variables for each building at the highest available resolution.
The last data were provided by Google for research purposes – the embeddings from the Population Dynamics Foundation Model (PDFM). This dataset contained around 250 feature embeddings and spatial identifiers.
Methods
The main strength of the paper was the methodological development of an efficient pipeline for source combination and testing of the experimental data application in practical settings.
The data engineering pipeline included API connections, custom algorithms for complexity reduction and efficient geographic resolution handling across different time horizons. This ensured the best-possible data available for each site.
The prediction and tuning of the models was then handled using classical machine learning and cross-validation frameworks of tabular data such as regressions, random forests, boosting algorithms and neural nets.
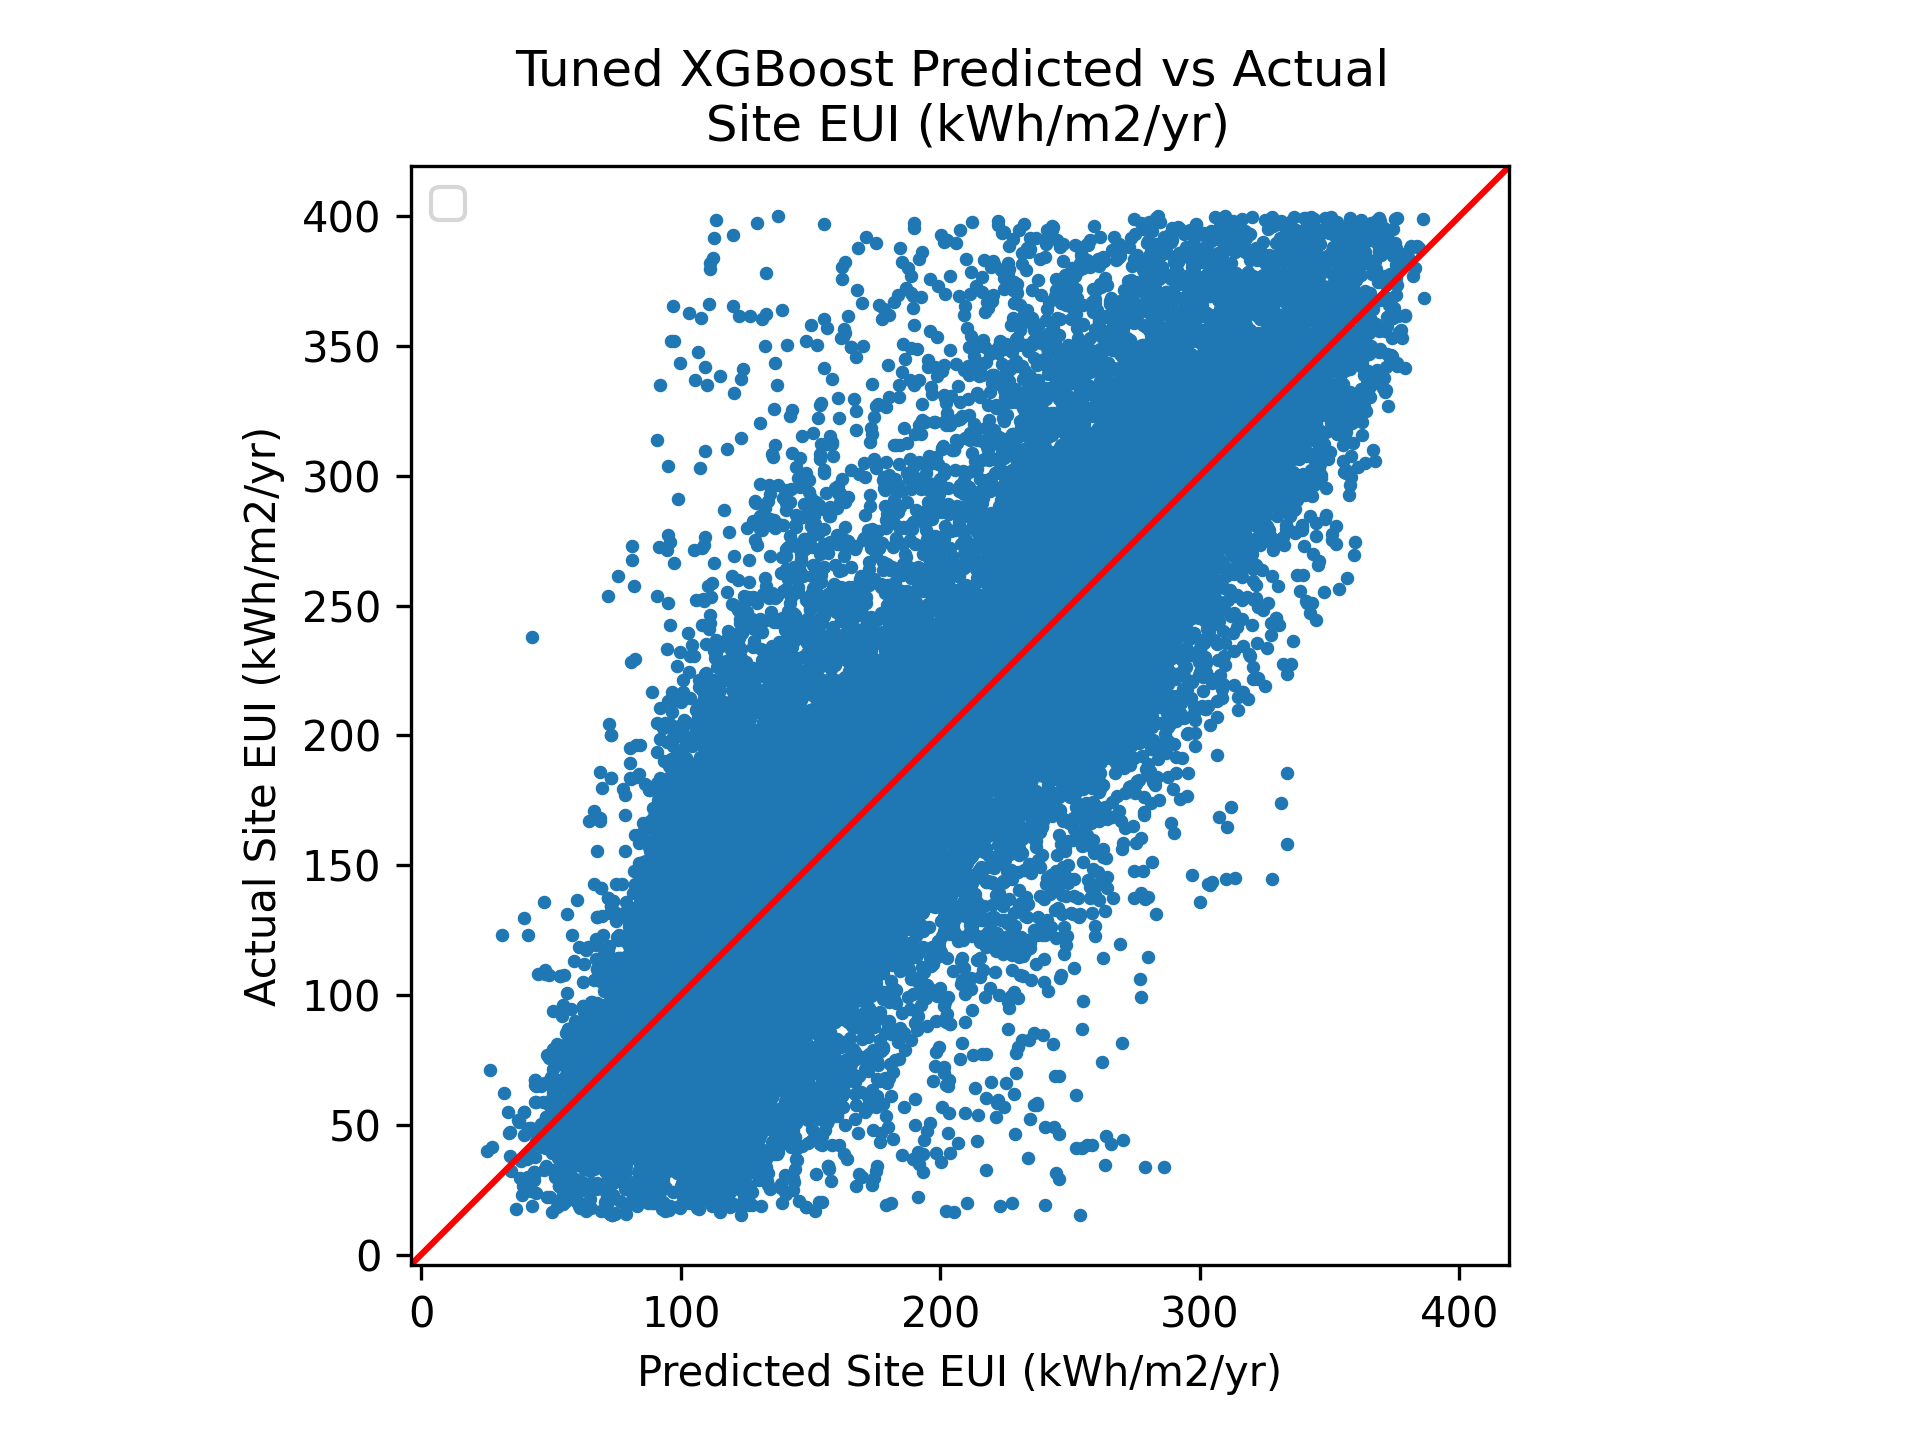
Figure 2: Actual vs predicted values of a tuned XGBoost model.
Results
XGBoost emerged as the best-performing model, explaining approximately 76% of the variance in site EUI (R²≈0.76) with a mean absolute error of ~31 kWh/m²/year and a 25.4% average prediction error (MAPE). The model was well-calibrated and low-bias, but point predictions remained noisy — 90% of observed values fell within a prediction interval of 105–237 kWh/m²/year, reflecting the high intrinsic variability of residential energy use.
The thesis has shown that diversity-poor feature spaces of open data are challenging for developing precise long-term energy prediction models. Hyperparameter tuning yielded negligible improvements, suggesting the baseline model had already extracted the available signal; further accuracy gains require additional explanatory variables rather than algorithm refinement.
The PDFM embeddings provided only marginal improvements at the building level (R² increase of 0.01), because site EUI variability is dominated by idiosyncratic occupancy patterns that are below the spatial resolution of the postcode-level embeddings. However, when predictions were aggregated to postcode level, an embeddings-only model outperformed building-level models on all error metrics — indicating that embeddings are better suited to area-level screening and hotspot identification than to asset-level forecasting.
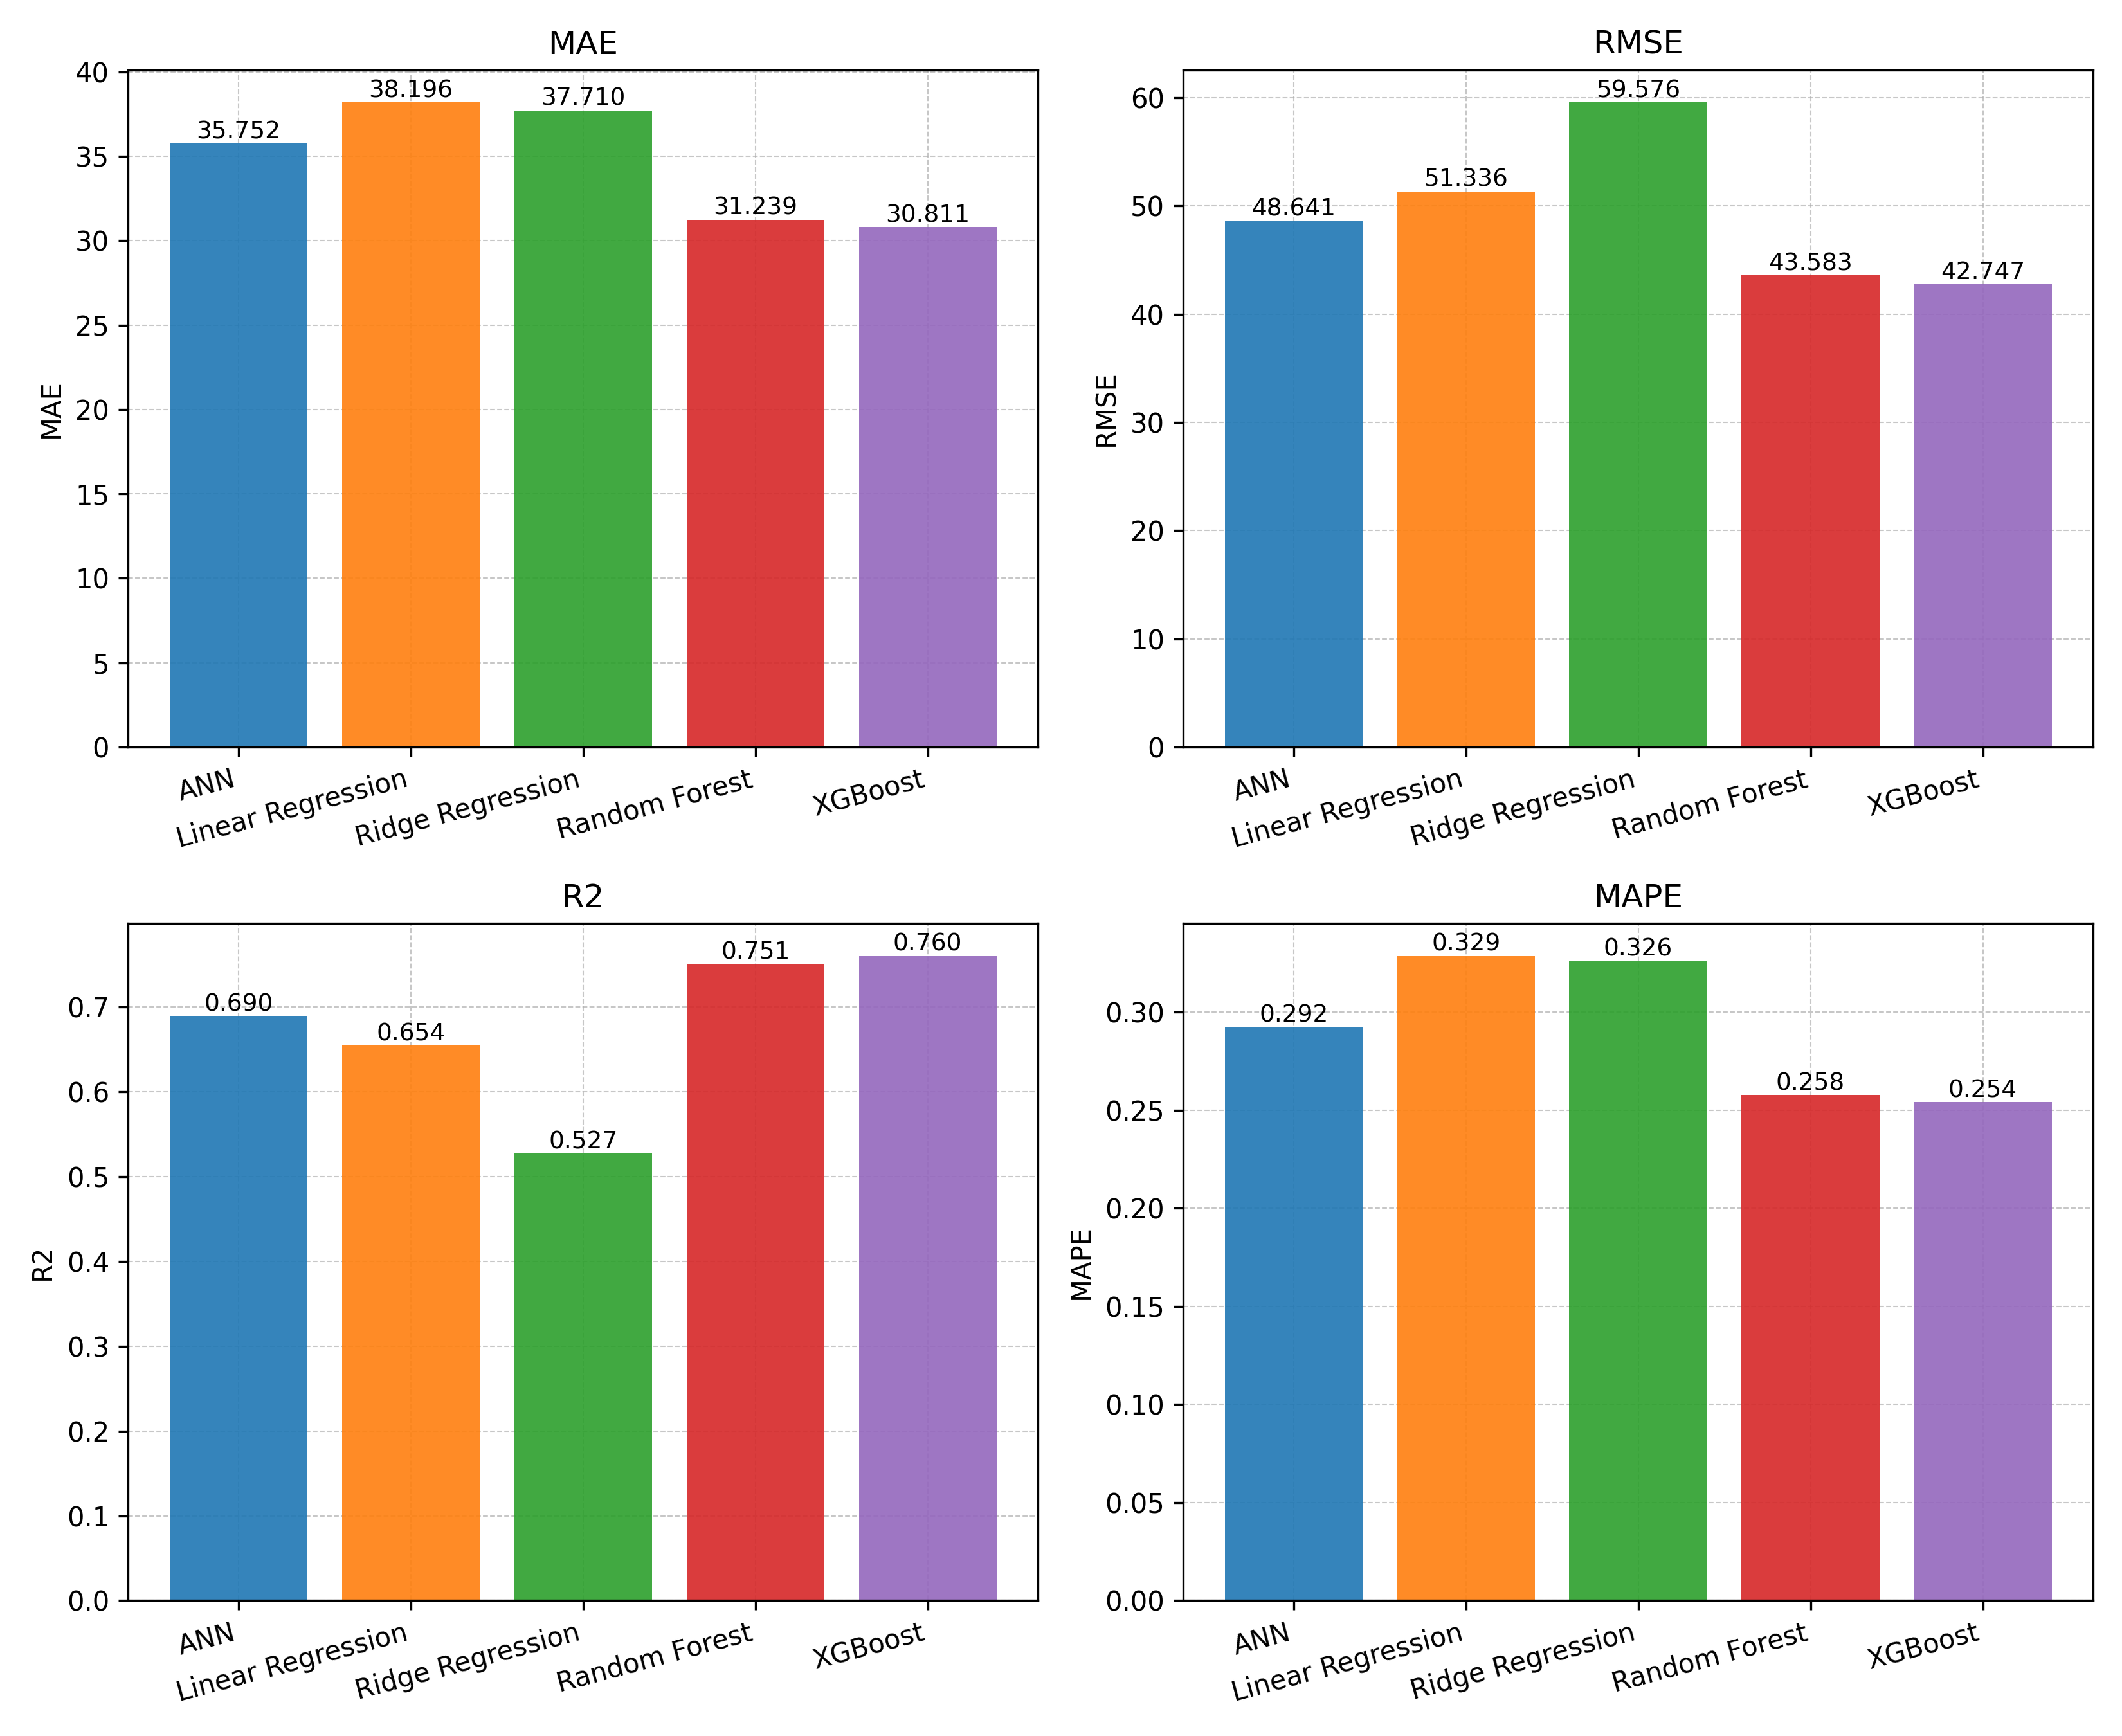
Figure 3: Performance comparison of selected ML models.
What This Means
For policymakers: Open-source building and climate data are sufficient to identify regional energy hotspots and benchmark building portfolios. A postcode-level embedding model can extrapolate energy demand to areas with sparse observations, supporting targeted retrofit programmes and compliance monitoring. However, individual-level predictions carry substantial uncertainty and should be used as bounded estimates rather than point values.
For analytics businesses: The pipeline demonstrates that scalable energy prediction is achievable without costly survey data. XGBoost on publicly available features delivers competitive performance, and integrating occupancy, system-level, or temporal features is the most likely path to further accuracy improvements. The postcode-level embedding approach also offers a practical screening tool for portfolio managers and underwriters.
For researchers: Long-term residential energy prediction depends less on algorithm choice than on feature richness and the ability to proxy latent behavioural factors. PDFM embeddings show promise for area-level geospatial inference tasks beyond energy prediction — heat demand, renovation rates, or energy hotspot mapping are natural candidates for future work.
Limitations
The study faced several constraints. The BPD sample over-represents multi-family buildings and hot climates, limiting external validity for the general U.S. residential stock. PDFM embeddings are available only upon request from Google, restricting reproducibility. The model is well-calibrated for the observed sample but should be used cautiously when applied to populations outside that distribution. Finally, a portion of the variance in site EUI is inherently unexplainable — driven by occupancy behaviour that no external dataset currently captures at scale.
Feel free to read the study here.